
Every business owner understands the trap in this headline, even if they have never applied it to a country.
A company can double its revenue while an early shareholder ends up with a disappointing return. The business may have issued new shares, invested at poor rates, paid too much for growth or started from a price that already assumed extraordinary success.
Growth and the return on one existing share are different numbers.
That distinction is easy to see on a cap table. It becomes harder to notice when the same problem is spread across an entire economy.
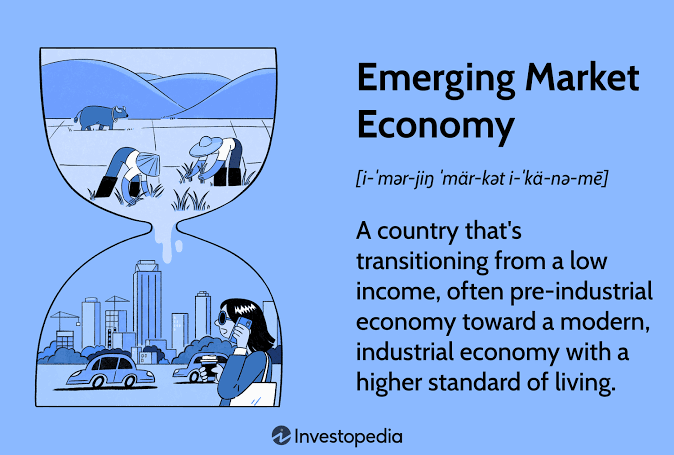
The familiar investment pitch goes like this: emerging economies grow faster than developed ones, corporate profits follow economic output, and the fastest-growing countries should therefore produce the strongest stock returns.
The first step can be true while the conclusion fails.
The evidence is weaker than the growth story suggests
Jay Ritter examined real per-capita GDP growth and inflation-adjusted stock returns across 15 emerging markets from 1988 through 2011.
In that sample, the cross-country correlation was negative 0.41 in local currencies and negative 0.47 in U.S. dollars. Countries with faster economic growth did not deliver stronger shareholder returns.
China supplied the most dramatic example. Using the MSCI China series from 1993 through 2011, Ritter reported approximately 9.4% annual real per-capita GDP growth alongside a negative 5.5% annual real stock return.
That result is powerful, but it needs context.
A later analysis by Jason Hsu and Ritter extended the emerging-market sample through 2019 and used mainland Chinese A-shares rather than the older MSCI China series, which had been weighted toward Hong Kong-listed shares and depositary receipts.
In the updated sample, the GDP-growth and stock-return correlation was positive 0.19 with a p-value of 0.50. Statistically, that is indistinguishable from zero.
Changing the Chinese market series changed the sign of the estimate. It did not rescue the original growth thesis. The updated evidence still found no reliable relationship between a country’s GDP growth and the returns earned by its public shareholders.
That is the honest conclusion. The relationship is not reliably negative in every sample. It is simply far too weak to support buying a country because its economy is forecast to grow quickly.
An economy is larger than its stock market
GDP measures production across an entire economy.
A stock index measures the return on a particular set of listed companies. Those companies may represent only part of the economy, and their owners have a claim on earnings per share rather than on national output.
Economic growth can benefit:
- Workers through higher wages
- Consumers through better products and lower prices
- Private companies that are not listed
- Newly created businesses
- The government through tax revenue
- New shareholders who provide capital later
None of those gains must flow automatically to the shareholders who already own today’s index.
A country can also grow by adding labor and capital without improving the return earned on each unit of invested capital. More factories and more sales are not enough if companies repeatedly invest in projects that earn weak margins.
The stock market cares about what remains for each share after the growth has been financed.
Where new shares enter the picture
Dilution is one important part of the gap.
Suppose a company’s total earnings rise from $100 million to $150 million. That looks like excellent growth. If the company doubles its share count while raising capital, earnings per share fall from $1.00 to $0.75.
The company is larger. The original share has a smaller claim on its profit.
At the market level, the mechanism is broader than a single follow-on offering. Fast-growing economies frequently bring new companies to market through initial public offerings. Those new listings expand the value and breadth of the stock market, but they do not retroactively enrich investors who owned the older listed companies.
Follow-on offerings can also enlarge the share count of companies already in the index. When the capital raised fails to produce enough additional per-share profit, existing shareholders absorb the dilution.
Schroders estimated annual share dilution at roughly 3.2% in emerging markets and 0.5% in developed markets. The estimate helps explain why aggregate business growth and earnings per share can travel at very different speeds.
J.P. Morgan Asset Management reached a similar conclusion using the 15 years through 2025. It estimated that net dilution reduced emerging-market earnings-per-share growth by about 400 basis points a year. In China, it estimated the EPS headwind at roughly 820 basis points annually.
Those figures describe a drag on EPS growth. They should not be presented as an automatic four- or eight-percentage-point subtraction from an investor’s total return. Valuation changes, dividends and starting prices also affect what the shareholder earns.
The distinction matters. Dilution weakens the bridge from aggregate profit to profit per share. Total return still depends on what investors paid for those shares and what the market later pays for them.
Dilution is not the only wedge
Even perfect per-share growth would not guarantee a strong return.
Starting valuation matters. A fast-growth story can be true and still produce weak returns if investors paid a price that already assumed even better results.
Corporate governance matters too. Controlling owners, managers or governments may direct corporate resources toward objectives that do not maximize value for minority shareholders.
State-owned enterprises may be expected to preserve employment, support strategic industries or offer cheap financing and inputs. Those policies can serve national goals while reducing the cash ultimately available to outside investors.
Currency adds another layer for U.S. investors. A strong local-market return can shrink when translated into dollars if the local currency weakens.
Index composition also matters. The companies that dominate an emerging-market index may not be the same businesses driving the country’s economic growth. A booming private technology or service sector may barely appear in the public benchmark.
This is why a GDP forecast cannot be converted directly into an ETF return forecast. Too many steps sit between national output and one shareholder’s account.
The founder analogy still works, with one limit
Anyone who has raised capital knows the emotional version of this problem.
A founder may celebrate higher revenue and a larger valuation while owning a smaller percentage after several funding rounds. Whether the result was worthwhile depends on what the new capital created per existing share.
The same principle applies to a public market: aggregate growth is valuable only when enough of it reaches each existing claim.
The analogy is not exact. A country is not one company, GDP is not corporate revenue, and an IPO by a new business does not directly dilute the shares of an unrelated listed company.
The useful transfer is narrower. Investors own securities, not the economy. They are paid through per-share earnings, dividends and the future price of those securities.
TheFinSense explains why emerging markets can underperform despite faster growth and models how a persistent per-share wedge can compound over time:
In that illustration, an investor starts with $25,000, adds $500 a month and invests for 25 years. One path compounds at an assumed 8% return. The second uses 4.8%, treating the 3.2-percentage-point Schroders dilution estimate as a persistent modeled wedge.
The resulting balances are approximately $625,707 and $365,387, a difference of $260,320.
That is an illustrative sensitivity model, not a historical emerging-markets fund return and not a claim that every investor literally lost $260,320 to dilution. Its purpose is to show what a persistent difference in per-share growth could do under stated assumptions.
Screen the numbers that can reach a share
The answer is not to avoid emerging markets. It is to stop treating GDP growth as the investable variable.
A better review starts with the following.
Earnings per share
Hsu and Ritter’s updated analysis found that real stock returns had a 0.54 correlation with real EPS growth across the emerging-market sample. The GDP-growth correlation was only 0.27 in the comparable shorter-period analysis and was not statistically significant.
Per-share earnings are much closer to the claim the investor actually owns.
Dividends per share
Dividends per share measure cash distributed to each share rather than the total cash paid by a growing market. Hsu and Ritter found a 0.47 correlation between real stock returns and real dividend-per-share growth in their sample.
Net issuance and buybacks
Look for changes in the aggregate share count of the underlying companies or index, not the number of ETF shares outstanding.
ETF shares are created and redeemed as investors move money into and out of the fund. A rising ETF share count does not mean its portfolio companies are diluting shareholders.
The relevant question is whether the businesses inside the fund are issuing more shares than they repurchase.
Return on capital
Rapid investment is useful only when the new projects earn acceptable returns. Revenue growth supported by poor capital allocation can make a company larger without making each share more valuable.
Starting valuation
A great economy can be a poor investment at an excessive price. Expected growth that is already embedded in the valuation leaves little room for disappointment.
Governance and shareholder treatment
Voting rights, related-party transactions, state influence, capital allocation and the treatment of minority investors determine how much corporate value reaches outside shareholders.
These measures do not remove risk. They point the analysis toward the part of economic growth an investor can actually own.
The bottom line
A fast-growing economy can build roads, factories, businesses and a larger middle class. Those are real gains.
They do not guarantee strong stock returns.
Between national output and the investor’s account sit new listings, additional shares, starting valuation, capital allocation, governance, index composition and currency translation. Economic growth may benefit workers, consumers and future businesses without producing matching returns for today’s public shareholders.
The evidence does not show that fast growth always causes weak returns. It shows something more useful: GDP growth has not reliably predicted which countries deliver the strongest stock returns.
The next time a fund is sold on a country’s growth forecast, ask a more precise question.
How much of that growth is expected to reach earnings and dividends per share after the new capital has been raised?
Danny Hwang is a quant analyst and the founder of TheFinSense, https://thefinsense.io/, where he models the hidden costs and dilution effects that separate headline growth from what investors actually keep. His work focuses on the gap between financial intuition and what the math shows.Headline: